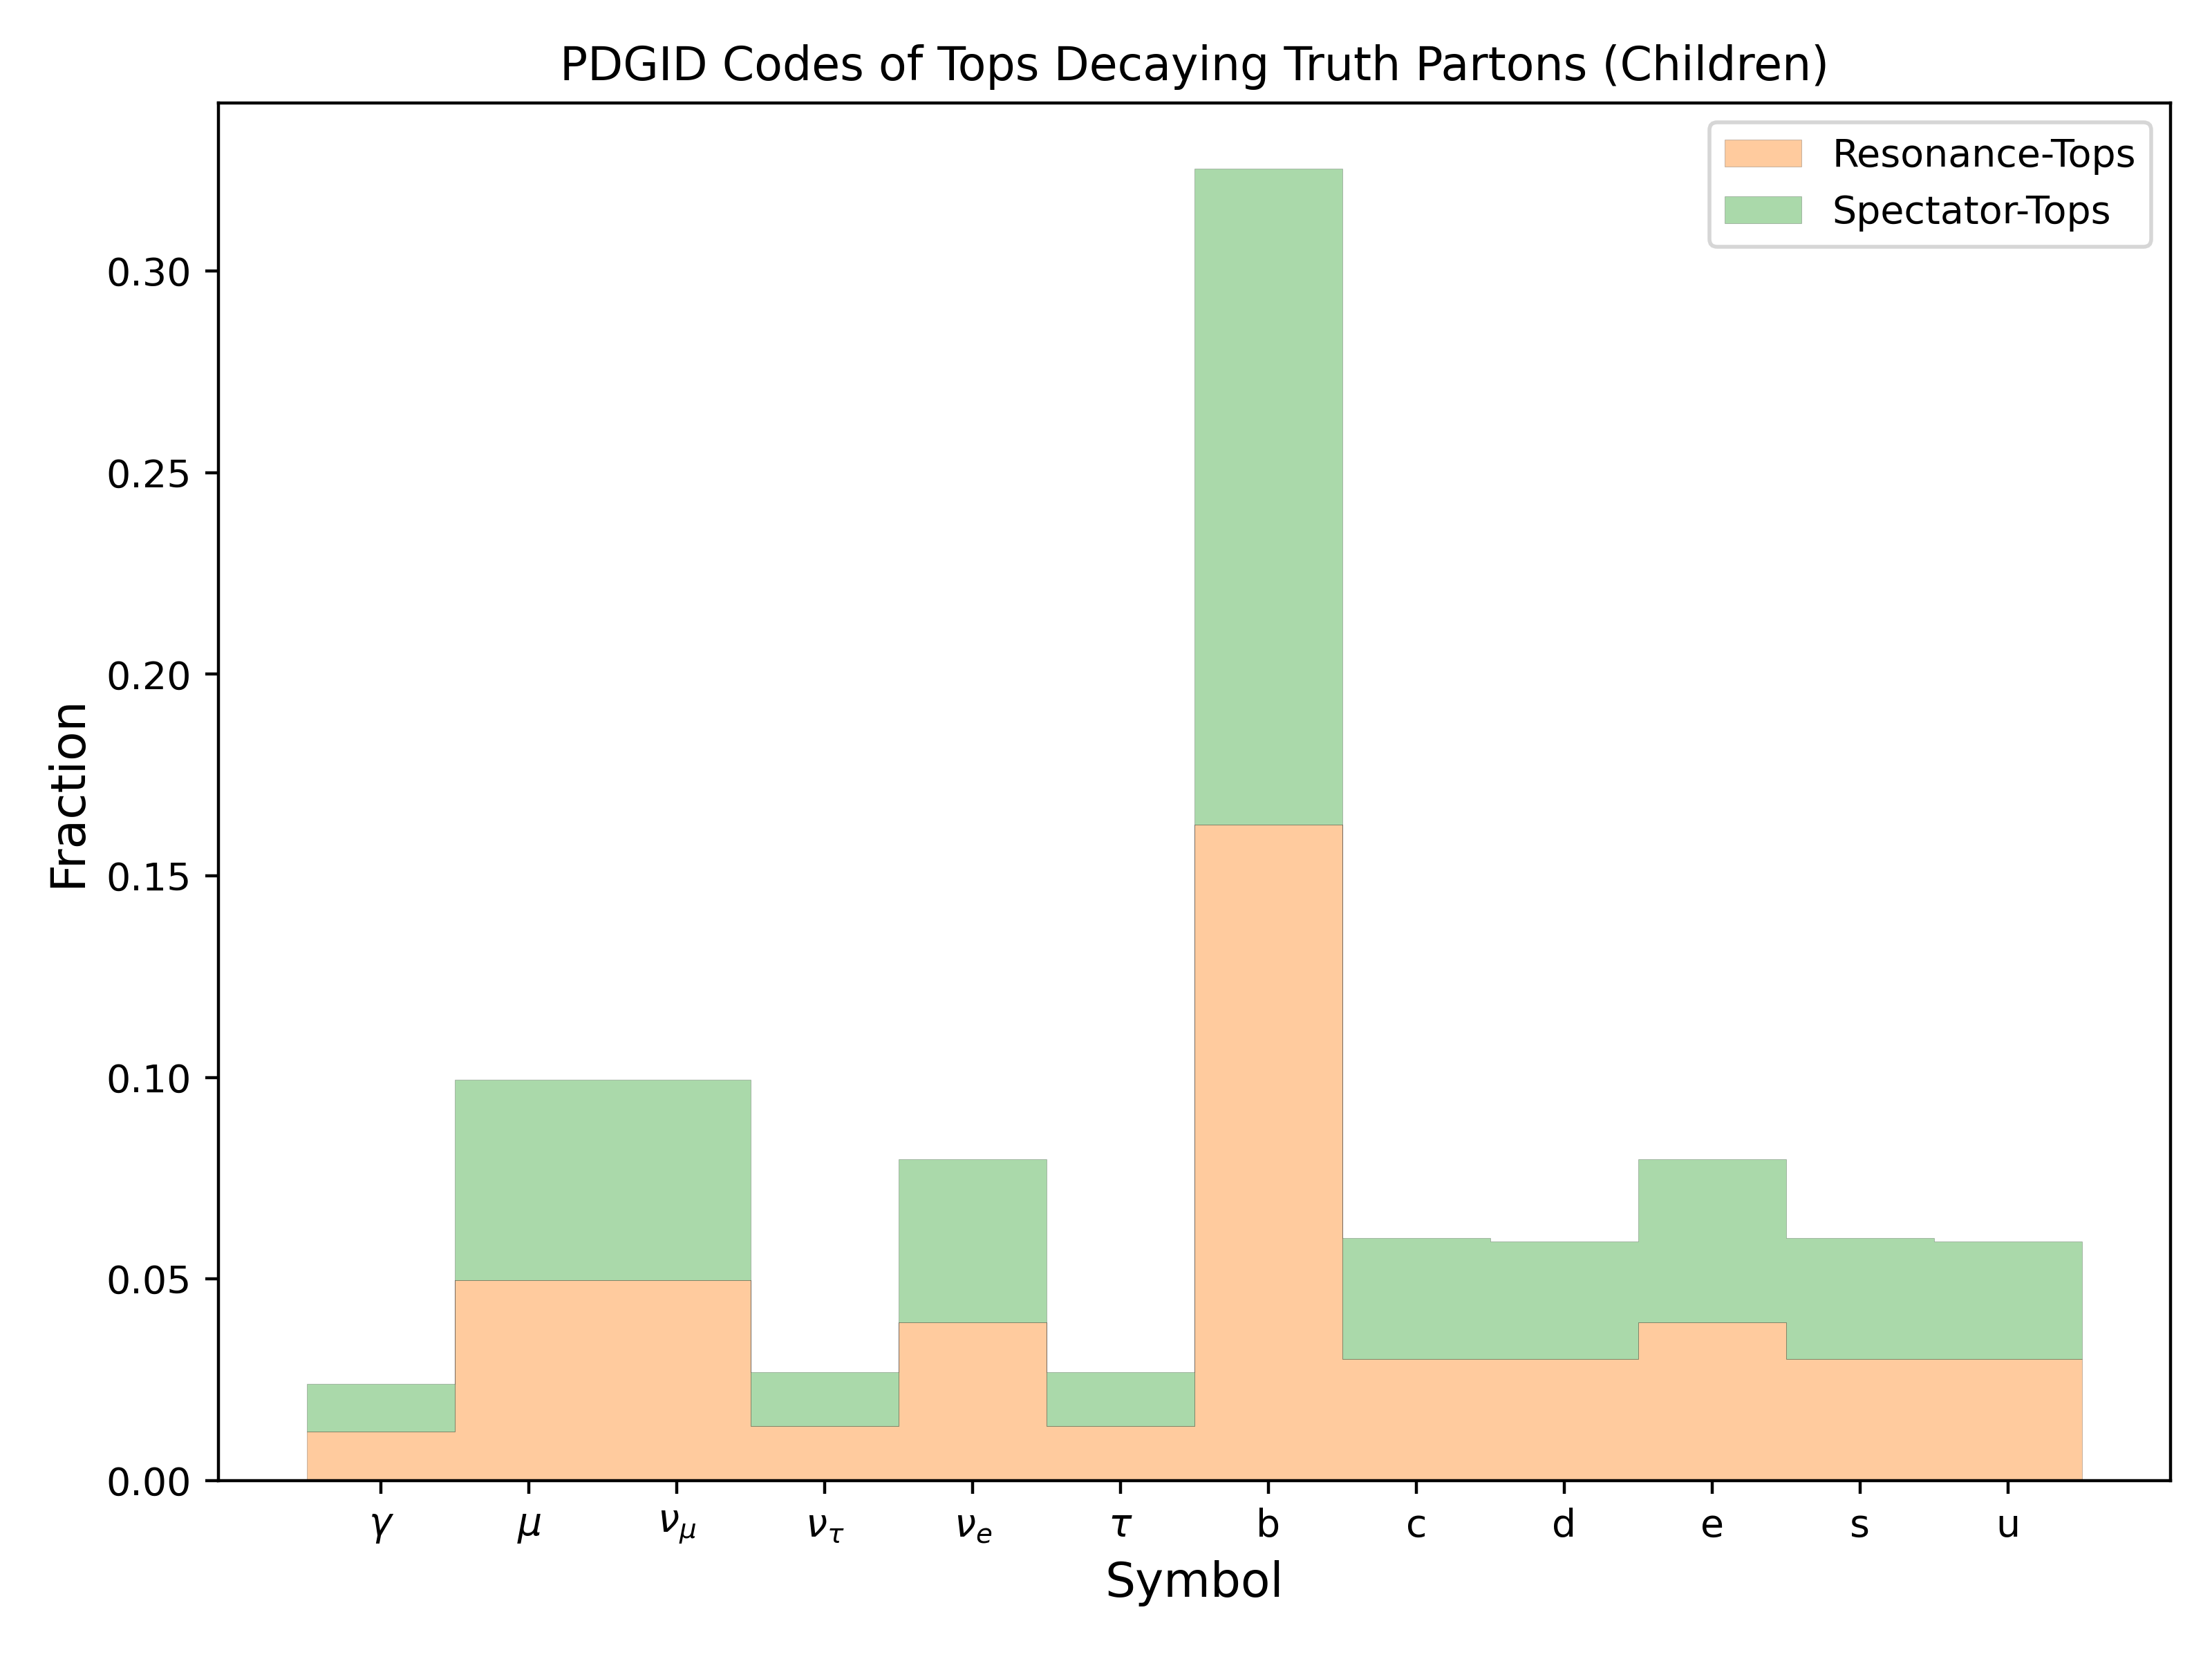
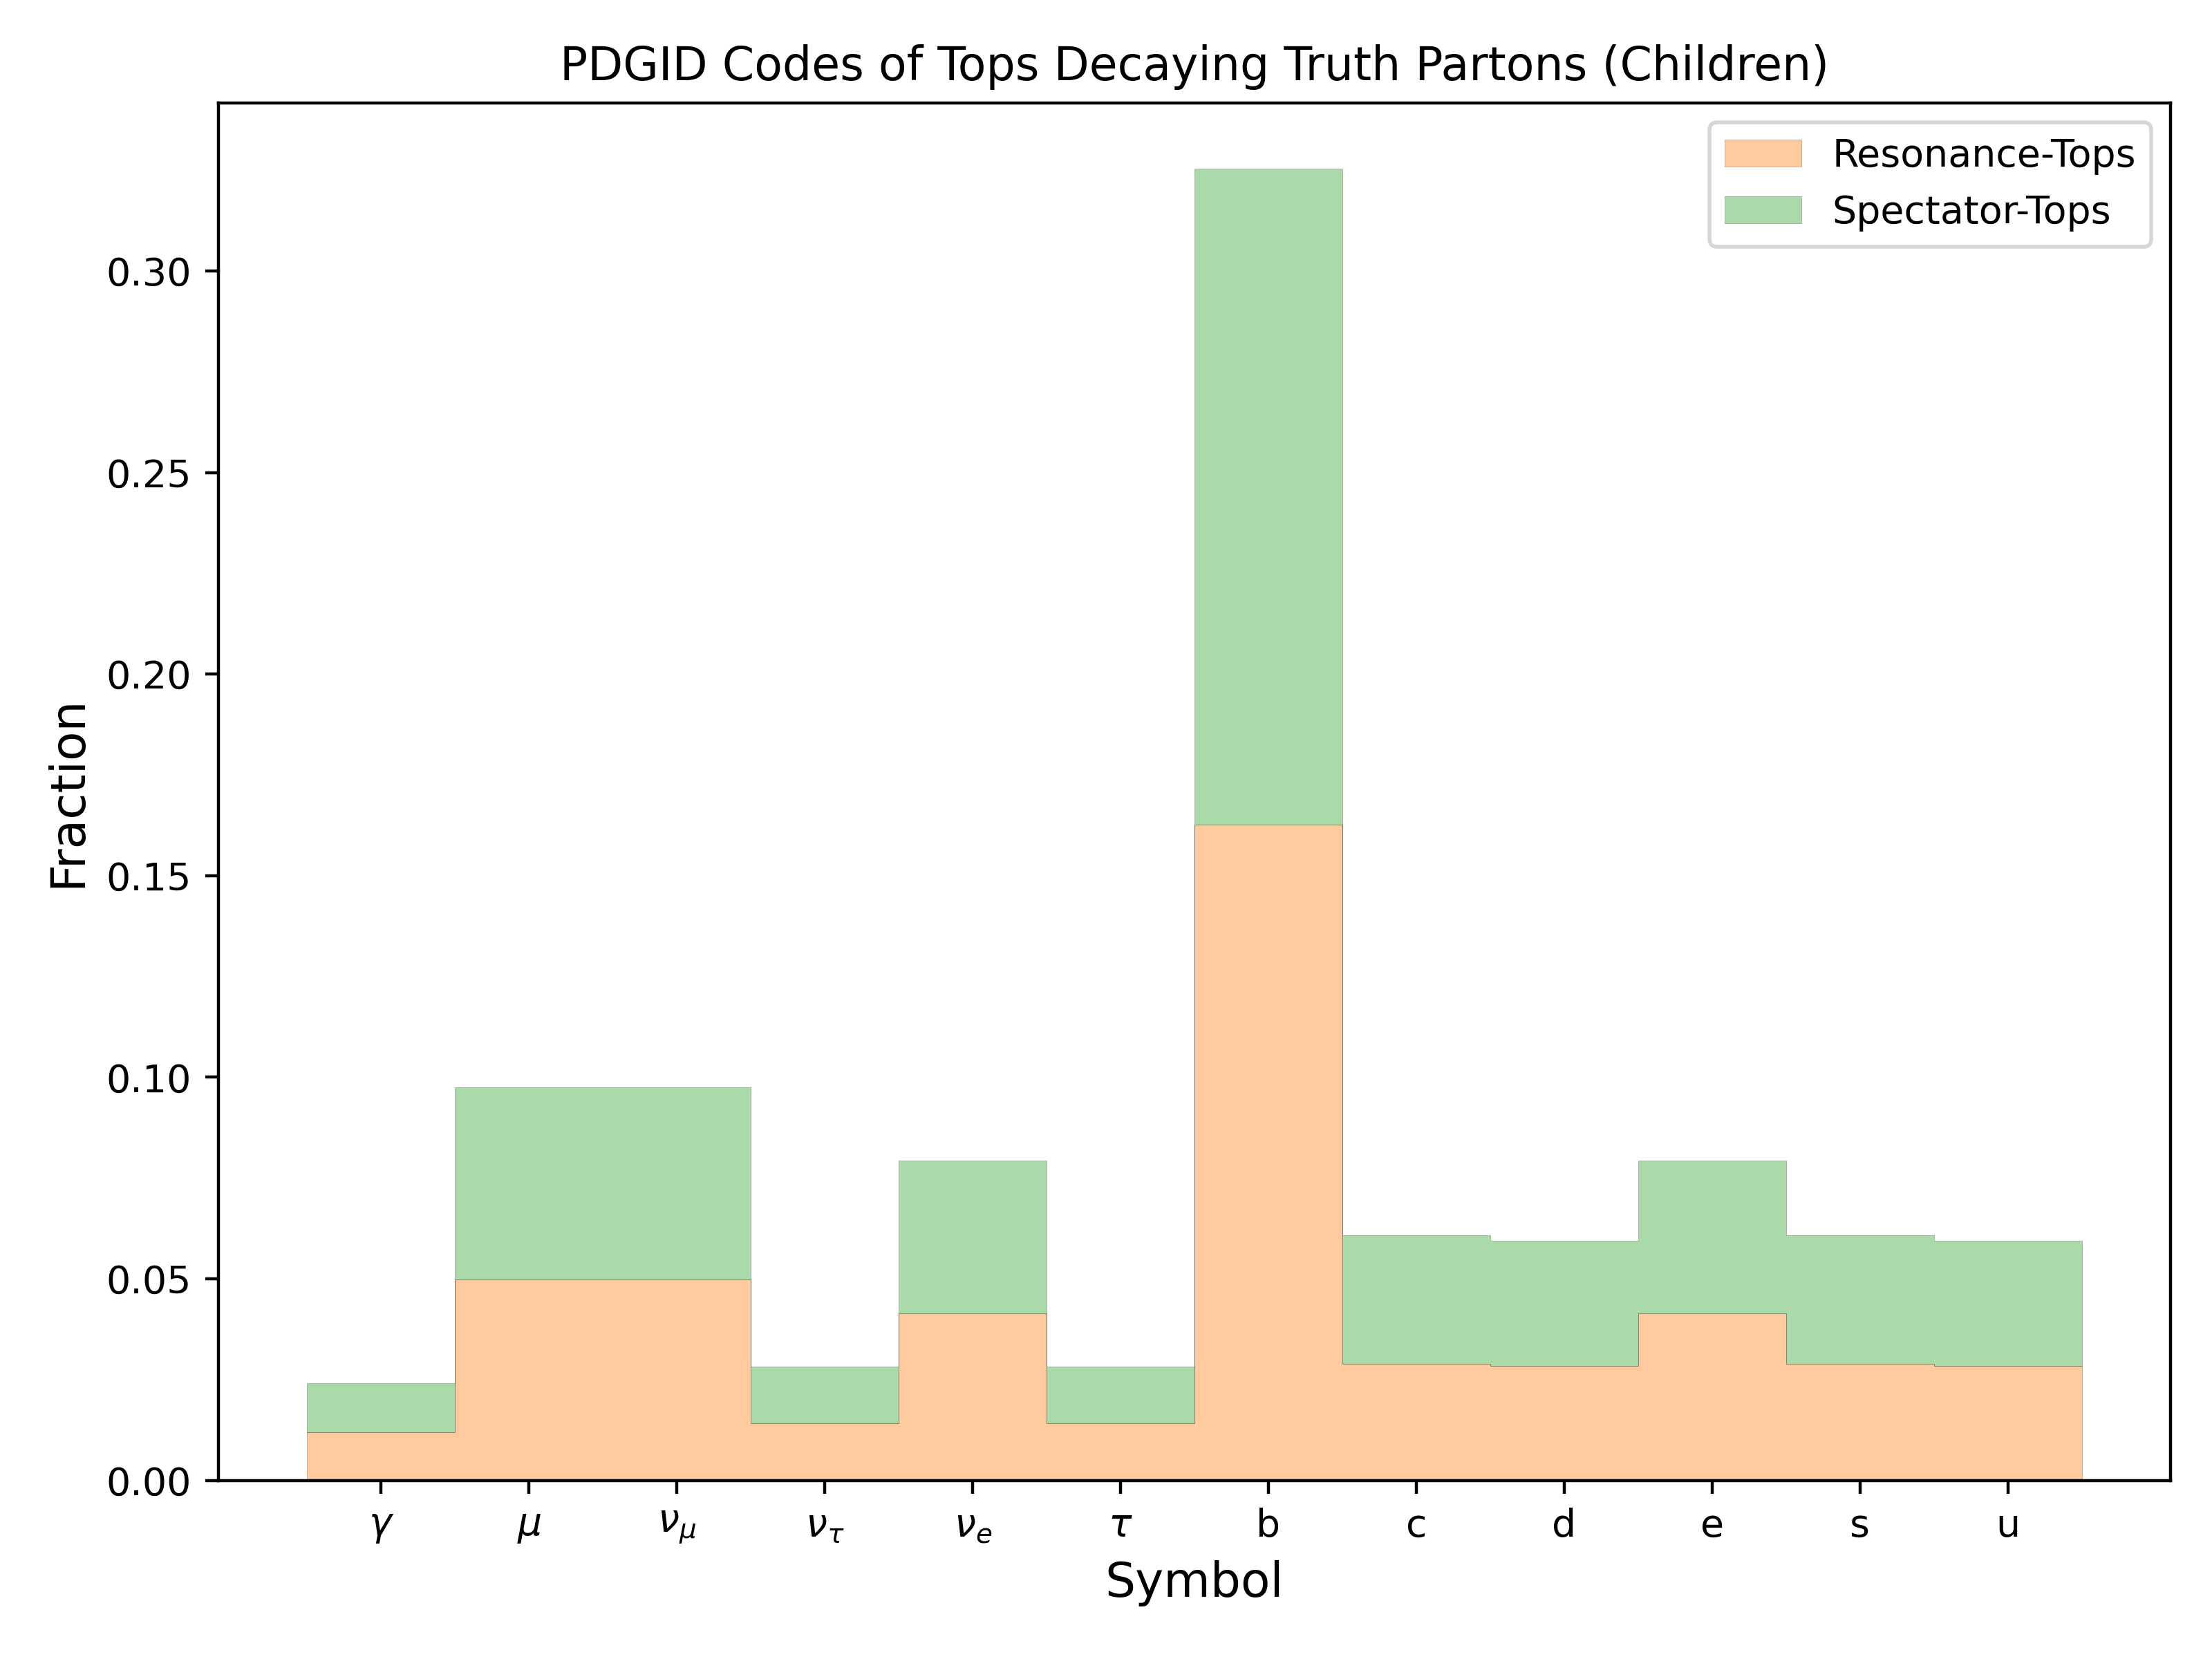
Figure.4.b
A set of normalized fractional plots of the PDGID codes from tops decaying into their respective children. The plots are segmented by resonance and spectator top decay.
Fraction values for Mass Point: 1000 GeV
 : 2.3913222376975236
 : 9.760464072716319
 : 9.760464072716319
 : 2.900454476994334
 : 7.848462122517806
 : 2.900454476994334
b: 32.537882140311815
c: 6.037230780219149
d: 5.988786358547723
e: 7.848462122517806
s: 6.037230780219149
u: 5.988786358547723
Mass Point: 400 GeV
Mass Point: 500 GeV

Mass Point: 600 GeV

Mass Point: 700 GeV

Mass Point: 800 GeV
Mass Point: 900 GeV

Mass Point: 1000 GeV
